More recently Gebhardt et al. (2000) and Ferrarese & Merritt (2000) independently discovered an even tigher relation between the MBH and the stellar velocity dispersion sigma of the host galaxy. In this case MBH~sigma alpha, where alpha ranges from 3.75 to 4.8.
The data from SUNNS and from related projects provide an excellent way to test this claims and explore the nuclei of disk galaxies, which were and still are, underrepresented in these relations. STIS kinematics, derived from ionized gas provide not only a ten-fold increase in spatial resolution, but also eliminate many systematic uncertainties arising from the poorly understood orbital anisotropy of the stars.
Black-Hole Mass Measurements
A first result of our survey is that regular gas kinematics is
indeed rare in galaxy nuclei, and is almost always associated with
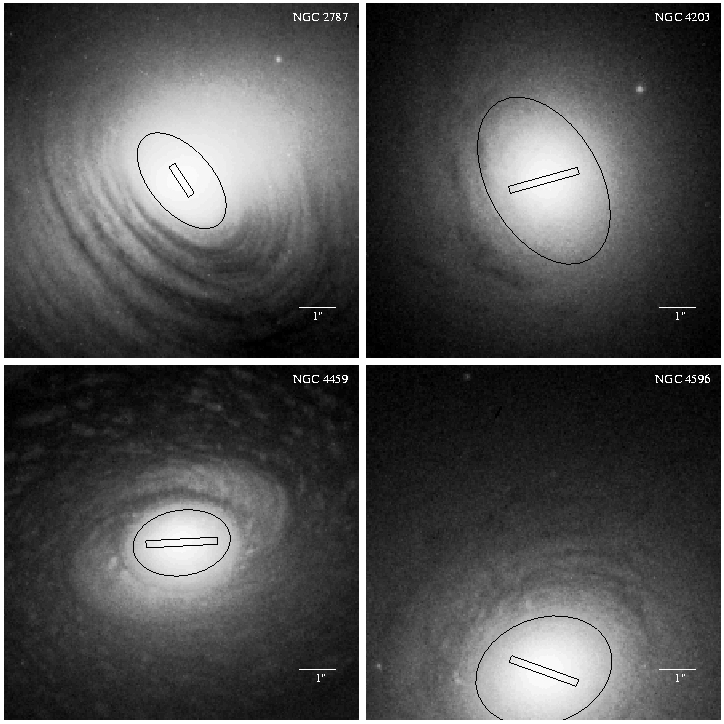
regular dust features (Ho et al. 2002, see also these figures). Figure 1 shows the 4
galaxies among the 24 of the SUNNS survey for which the
kinematical modeling of the ionized gas was feasible, measuring
the MBH for 3 galaxies (in the case of NGC
2787, NGC 4459, and NGC 4596) and placing an upper limits on the
MBH of NGC 4203 (Sarzi et al., 2001). The
measured MBH values lead to mean a MBH/Mbulge ratio around 0.0025, showing
the Magorrian et al. (1998) MBH measurements
were somehow over estimated.
|
|
| Figure 1 (left): HST WFPC2/PC V-band
images of the nuclear region of NGC 2787, NGC 4203,
NGC4459, and NGC4596, showing the STIS slit position and
the adopted orientation for the gaseous disk, on the base
of dust-lanes features. The lenght of the slit aperture
indicate the extent of the ionized gas rotation curves.
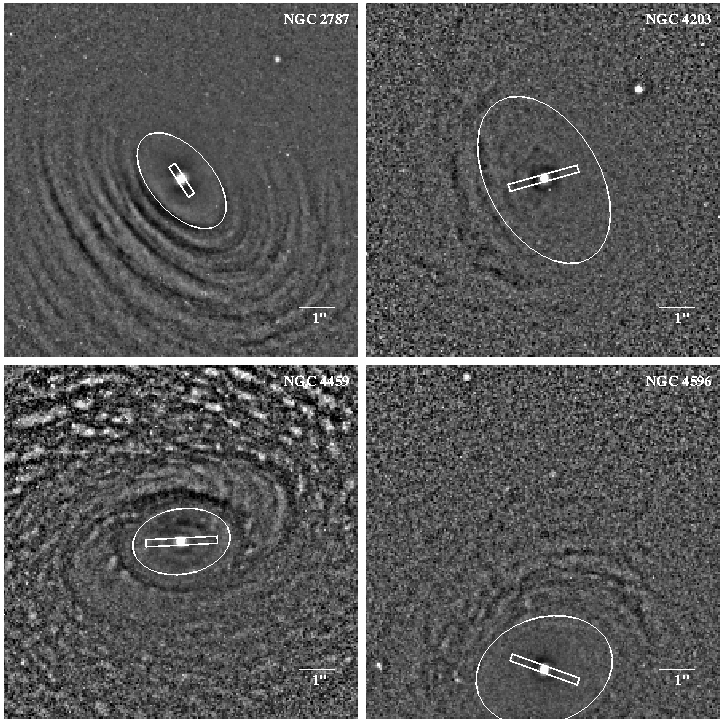
Figure 2 (right): Unsharp-masked versions of the same images of Figure 1, further enhancing the dust-lane patterns tracing the gas spatial distribution. |
|
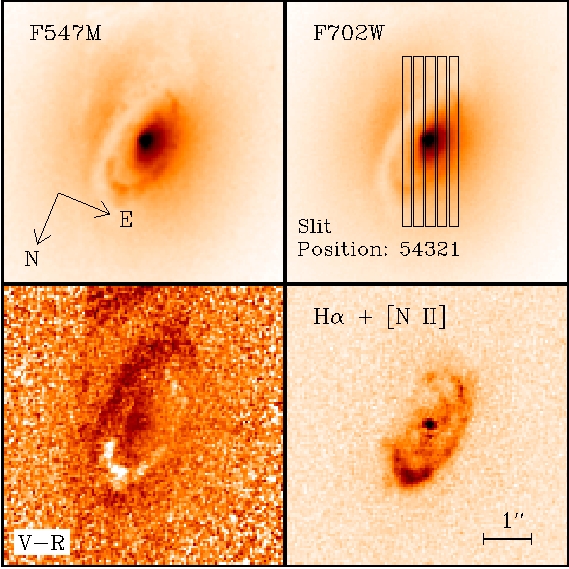
A second application from our group (to the nucleus of NGC
3245, Barth et al., 2001) is shown in Figure 2 and 3. In this case
the mapping of the gas velocity field and surface brightness, with
the aid of 5 parallel slit position and narrow-band Halpha imaging
respectively, enabled a superior detailed modeling. This provided
a very precise measurement for the MBH, of
2.1 x10⁸ Msun.
|
|
||
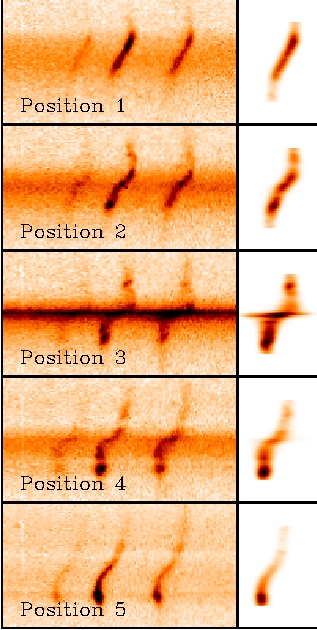
| Figure 4 (right): Portion of the 5 two-dimensional STIS spectra showing the Halpha + [NII] blend (left panels) and synthetic spectra showing for each slit position the best fitting disk model (right panels). The spatial axis is vertical with the same orientation as in Figure 3 and the wavelength increase to the right. | |||
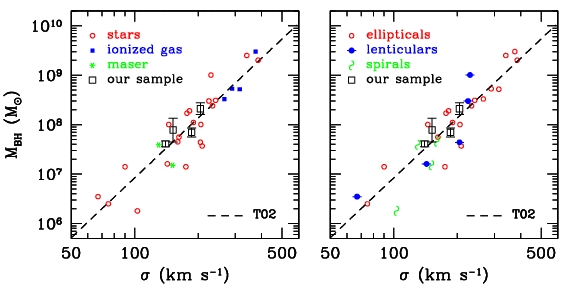
Taken together, our 4 MBH measurements
support the MBH-sigma relation (Figure 5,
using the compilation of Tremaine et al. 2002). Based on the
analysis of the ionized gas kinematics, our MBH measurements are not only consistent with the
most accurate MBH values obtained studying
other kind of tracers for the potential, but also extend
considerably the range of Hubble types where such comparison is
possible. Furthermore by measuring 4 new MBH
in disk galaxies, we made a substantial step toward a complete
demography of supermassive black holes at this Hubble type
regimes.
|
| Figure 5: Our 4 MBH determinations (large open squares and circles) along with some of the MBH measurements from which the MBH-sigma relation (according to Tremaine et al. 2002, solid line) was derived. In the left panel different symbols correspond to the different tracer of the potential used to obtain the MBH, while in the left panel different symbols indicate the host galaxy Hubble-type. |
Black-Hole Mass Upper Limits
If the observed ionized gas kinematics is irregular, it is still possible to derive, owing to the resolving power of HST, astrophysically interesting upper-bounds on the MBH, by explaining the observed central emission-lines width in terms of gas motions dominated by gravity. On the other hand, the unsettled importance of non-gravitational forces and the lack of spatially resolved information on the gas emissivity prevent us from also setting a lower limit on MBH from central emission-line widths.
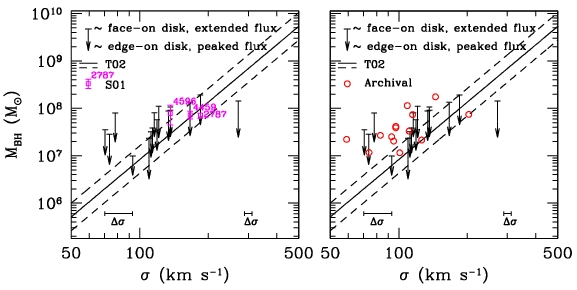
Figure 6 shows the result of this exercise for 16 galaxies in
the SUNNS sample (Sarzi et al. 2002). The derived +1sigma upper
limits are remarkably consistent with the MBH~sigma relation and our own BH measurements,
suggesting that in massive bulges (sigma < 100 km/s) BHs with
exceptionally high MBH must be rare,
On the other hand, the finding that in the three galaxies with the
smallest sigma the derived MBH upper limits
lie systematically above the MBH~sigma
relation suggests that non-gravitational forces could
substantially contribute to the observed line widths in this kind
of objects.
We further investigate this possibility by extending this
analysis to more spiral galaxies with archival HST
spectra (Sarzi 2004). Also in this case the derived upper limits
are consistent with the MBH~sigma relation,
except still for the objects with the smaller sigma, which
appear to depart more from it.
|
| Figure 6: MBH upper limits in the MBH~sigma relation. The 1-sigma upper and lower limits on MBH (thick downward arrows) obtained by the Keplerian disk modelling (Sarzi et al. 2002) are compared with the range of MBH values expected from the MBH~sigma relation. (solid and dashed lines, from Tremaine et al. 2002). For comparison the left panel also shows the MBH measurements obtained from extended kinematics in three of these galaxies (violet square), wherease the right panel shows more upper-limits derived from HST archival data (red circles, from Sarzi 2004). |
Signs of Advective Accretion
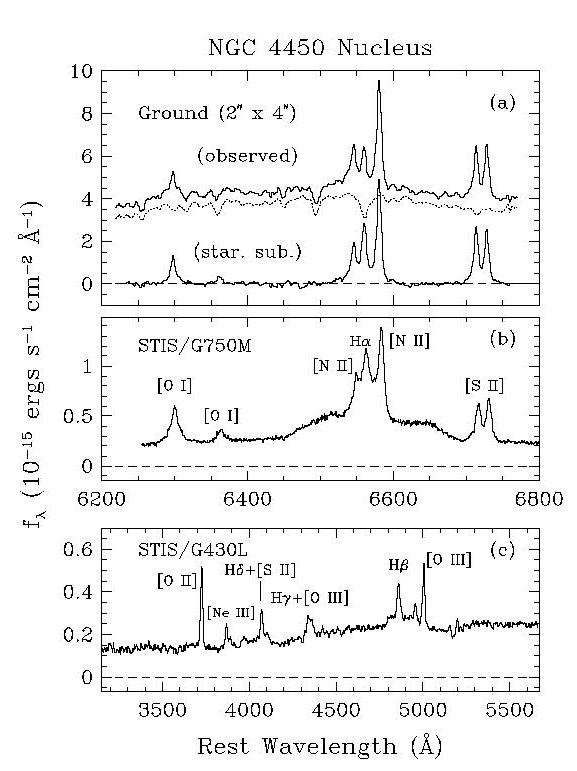
The data from SUNNS can also be key in understanding why many
nuclei with BHs are so dark or inactive. In two LINERS (NGC 4450,
Ho et al., 1999; NGC 4203, Shields et al., 1999) from the SUNNS
sample, we have discovered very broad (FWHM >10000 km/s) but
low-luminosity line-emission, showing that material is indeed very
close to the central BH (Figures 6 and 7). This detection was only
possible with the greatly improved contrast between the nucleus
and the stellar light contamination that HST affords
(Figure 6). Together with the broad-band SED of these nuclei,
which is anemic in the UV, this clearly indicates that accretion
in these objects is occuring in an alternate, "dark" mode of
accretion, called advection dominated accretion (Narayan et al.,
1998).
|
Figure 7 (left): The broad Halpha line emission in NGC4450 (middle panel), discovered with STIS. The top panel shows ground-based spectra (2" x 4", from Palomar, Ho et al., 1995), dominated by projected star light. Only in the high resolution HST spectra (middle panel), does a double-shouldered profile become apparent, indicating that also in this low-luminosity AGN material is orbiting at very small radii. The bottom panel shows the blue spectrum from the SUNNS project; note that Hbeta has a very broad component, too. |
| Figure 8 (right): The broad Halpha line emission in NGC4203 (upper panel). Also in this low-luminosity AGN, the high resolution HST spectra (top of upper panel) unvealed the presence of a double-shouldered profile (bottom of upper panel), after subtracting the stellar continuum, the narrowest Halpha and [NII] forbidden lines, and a ``normal'' broad Halpha line. The lower panel shows the blue spectrum from the SUNNS project; note that Hbeta has a very broad component, too. |
|
Nuclear Stellar Populations
One of the key objectives of the SUNNS survey is to constrain
the relative rôle of accretion onto BHs and star-formation
in powering AGN activity. In Sarzi et al. (2005) we analysed our
blue STIS spectra to constrain the amount of nuclear star
formation in the central parsecs of the SUNNS galaxies. By
matching to the data optimal combinations of Bruzual & Charlot
(2003) single starburst models we found that the 80% of bulges
host old (>5x10⁹yr) stellar populations in their
central parsecs, consistent with the idea that massive
nuclear star formation is hampered by the tidal field of BHs.
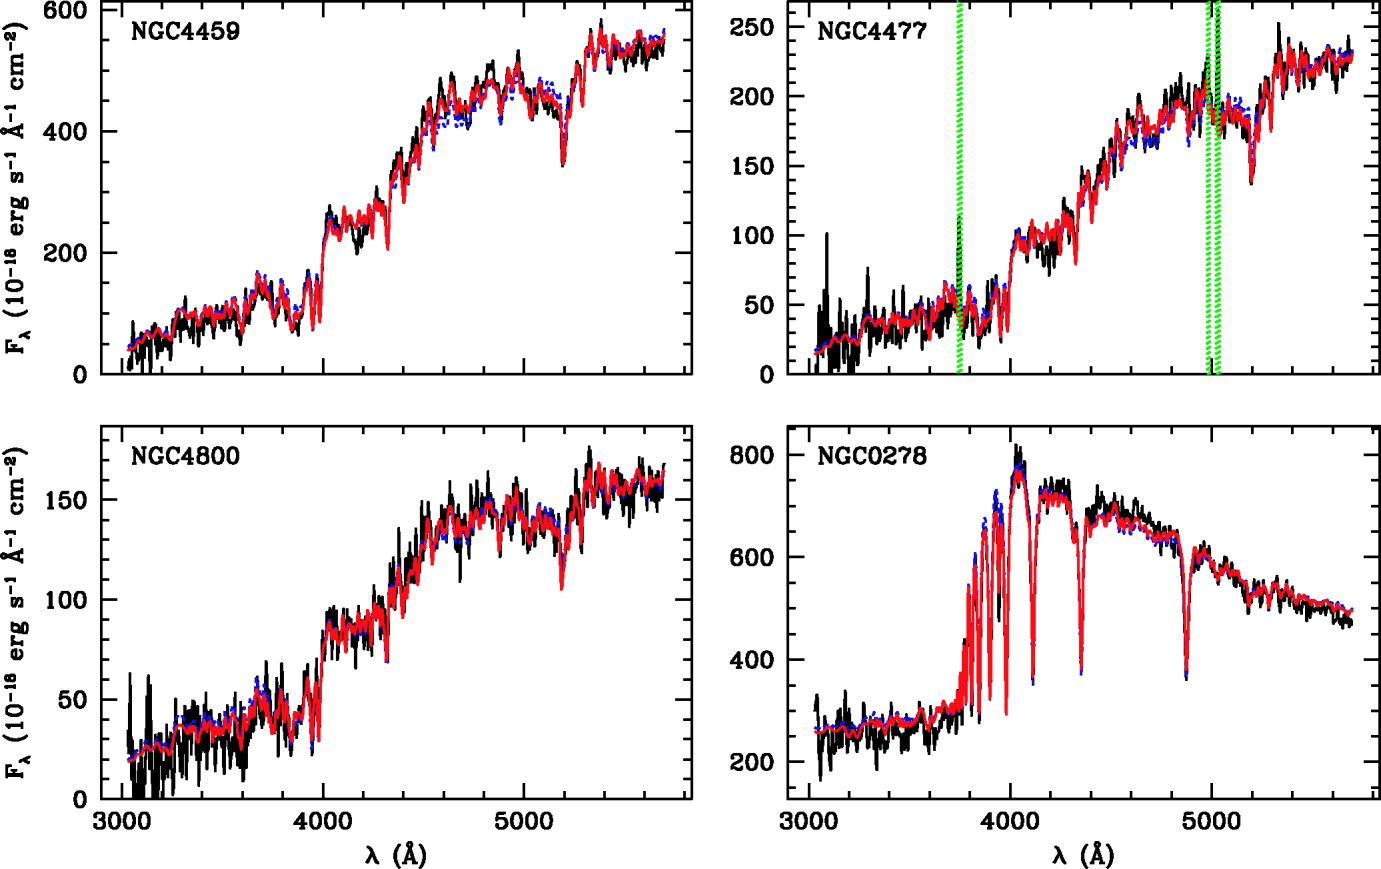
25% of the SUNNS nuclei do show some young stars
(<109yr), but only in the case of the nuclear
cluster in NGC278 do these stars dominate the observed
spectra. Furthermore, we found that star formation is
insufficient to power the AGN activity observed from the ground
over ~100pc scales, even when considering conservative
upper-limits for the amount of O-stars.
Our findings reinforce the picture wherein Seyfert nuclei
and the majority of LINERs are predominantly accretion-powered
and suggest that much of the central star formation in H II
nuclei is actually circumnuclear. Similar results were
independently derived also by Gonzales-Delgado et al. (2004)
|
|
| Figure 9 (left): Four examples of nuclear blue spectra extracted from the central 0"25 × 0"2 of our sample galaxies. The red lines show the best-matching multiple-starburst models with supersolar (Z = 2.5 Zsun) metallicity. Models with solar metallicity (Z = 1 Zsun blue dashed lines) always lead to a worse fit. The vertical green lines show regions that were excluded from the fit because affected by gas emission. | |
|
|
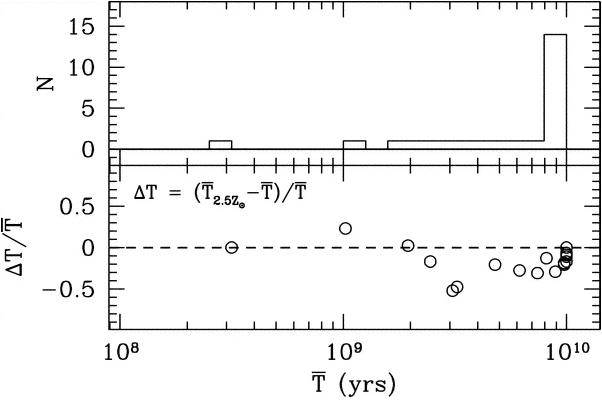
| Figure 10 (right): Distribution of the luminosity-weighted age estimates obtained from the best-fitting multiple-starburst models (top), compared with the luminosity-weighted ages from models of supersolar metallicity (bottom). The adopted stellar metallicity has only a little impact (≤ 30%) on the luminosity-weighted ages. | |
Excitation Sources
By combining the emission-line information present in both
blue and red spectra, we are now pushing the last stage of our
survey: understanding the gas excitation in galactic nuclei and in
particular how this varies when moving from ~10 to ~100 parsecs
scales (Shields et al. 2007, ApJ, 654, 125).
From comparison with ground based results, we find that the
central emission regions are resolved and show modest gradients
in the line-intensity ratios (Figures 11 and 12). The SUNNS
nuclei show little tendency to change their spectral
classification as a function of aperture size. This is expected
in the case of the most concentrated, accretion-powered LINER 1s
and Seyfert sources. However, for the HII/LINER "transition"
objects this result may be in conflit with the customary
interpretation of these sources as composity systems.
Another important result of this work, is that it provides a
strong basis for assessing the similarity between the center of
the Milky way and other galactic nuclei. We find that the
Galactic Center can indeed be considered a typical low-luminoisty
emission-line nucleus.
|
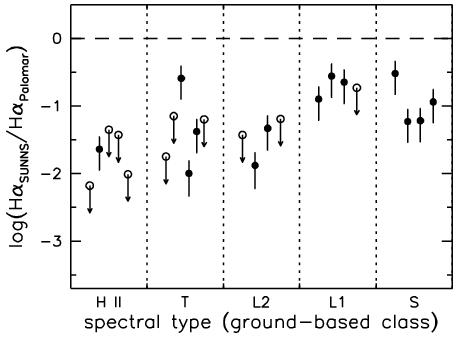
Figure 11 (left): Ratio of narrow Halpha flux measured in the SUNNS data (over ~10pc scales) relative to that measured at Palomar (over ~100pc scales; Ho et al., 1995), as a function of ground-based spectroscopic class as determined from the Palomar spectra. Notice how sources showing the strongest indication of accretion power (LINER 1s and Seyferts) display the largest ratios, implying greater concentration. In contrast, HII nuclei show the smallest ratios (4/5 show no emission at HST resolution), consistent with our previous finding that star formation in H II nuclei is circumnuclear. |
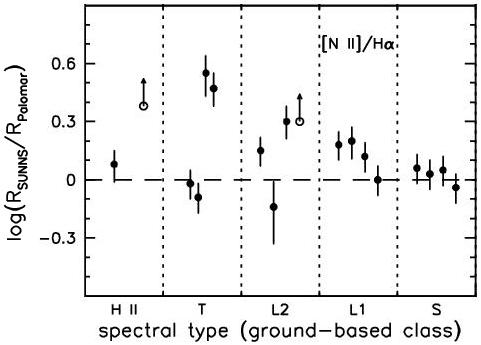
| Figure 12 (right): SUNNS/Palomar ratio of the [NII]/Halpha diagnostic flux ratio, as a function of ground-based spectroscopic class. As expected, the line-ratios of the most concentrated sources is almost unchanged. On the other hand, the position of the "transition objects" (T) is not entirely consistent with the standard picture for these composite nuclei as a mix of AGN emission and circumnuclear HII regions. Indeed, only in half of the cases our HST data appear to have excluded the circumnuclear nebulosity and show spectra resembling LINER or Seyfert emission. |
|
Collaborators in this project are Hans-Walter Rix (MPIA), Marc
Sarzi (Hertfordshire), Joe Shields (Ohio U.), Luis Ho (OCIW), Greg
Rudnick (NOAO), Alex Filippenko (Berkeley), Dan McIntosh
(Massachusetts), Wallace Sargent (Caltech), and Aaron Barth (UC
Irvine).
References
- Bruzual A., & Charlot, S. 2003, MNRAS, 344, 1000
- Ferrarese, L., & Merritt, D., 2000, ApJ, 539, L9
- Gebhardt, K., et al., 2000, ApJ, 539, L13
- González-Delgado, R., Cid Fernandes, R., Pčrez, E., Martins, L., Storchi-Bergmann, T., Schmitt, H., Heckman, T., & Leitherer, C. 2004, ApJ, 605, 127
- Ho, L., Filippenko, A., & Sargent, W.L.W., 1995, ApJS, 98, 477
- Ho, L., Rudnick, G., Rix, H.-W., Shields, J., McIntosh, D., Filippenko, A, Sargent, W., & Eracleous, M., 2000 Apj, 541, 120
- Ho, L., Sarzi, M., Rix, H.-W., Shields, J.C., Rudnick, G., Filippenko, A., & Sargent, W, 2002, PASP, 114, 137
- Kauffmann, G., & Haehnelt, M., 2000, MNRAS, 311, 576
- Magorrian, J. et al., 1998, AJ 115, 2285
- Barth, A., Sarzi, M., Rix, H.-W., Ho, L.C. & Filippenko, A., 2001, ApJ, 555, 685
- Sarzi, M., Rix, H.-W., Shields, J., Rudnick, G., Ho, L., McIntosh, D., Filippenko, A., & Sargent, W, 2001, ApJ, 550, 65
- Sarzi, M., Rix, H.-W., Shields, J., Rudnick, G., Ho, L., McIntosh, D., Filippenko, A., Sargent, W., Barth, A., 2002, ApJ, 567 237
- Sarzi, M., Rix, H.-W., Shields, J., Ho, L., Barth, A., Rudnick, G., Filippenko, A., & Sargent, W. 2005, ApJ, 628, 169
- Sarzi, M., 2004, Coevolution of Black Holes and Galaxies, from the Carnegie Observatories Centennial Symposia. Carnegie Observatories Astrophysics Series. Edited by L. C. Ho, 2004. Pasadena: Carnegie Observatories
- Shields, J., Rudnick, G., Rix, H.-W., Ho, L., McIntosh, D., Filippenko, A., Sargent, W., & Sarzi, M., 2000, ApJ, 534, L26
- Shields, Rix, H.-W., Sarzi, M., Barth, A., Filippenko, A., Ho, L., McIntosh, D., Filippenko, A., Rudnick, G., & Sargent, W., 2007, ApJ, 654, 125
- Narayan R., Mahadevan R. & Quataert, E., 1998, Theory of Black Hole Accretion Disks, edited by Marek A. Abramowicz, Gunnlaugur Bjornsson, & James E. Pringle. Cambridge University Press, 1998., p.148
- Tremaine, S., et al. 2002, ApJ, 574, 740
Back home
Last modified: Thu Sep 21 11:05:23 GMT 2006